Releases Details
MaxCyte Reports Third Quarter Financial Results
MaxCyte Reports Third Quarter Financial Results
Third Quarter and Recent Highlights
· Total revenue was
· Excluding Strategic Platform License (SPL) Program-related revenue, revenue from cell therapy customers was
· SPL Program-related revenue was
· Revenue from drug discovery customers was
· With the addition of
"We are pleased to report very strong third quarter results driven by ongoing strength in sales to cell therapy customers and robust SPL Program-related revenue." said
"We continue to expand our customer base and increase the number of strategic partnerships, now with 15 SPL agreements in place following the announcement of our agreement with Nkarta in early November. The vast majority of our SPL agreements enable
We are also making important and strategic investments in our business, expanding our marketing, R&D and product development capabilities, launching innovative solutions to drive future growth, bolstering our leading internal and field-based cell engineering expertise, expanding our manufacturing capabilities as our customers move closer to commercialization, and adding strong talent across all facets of our business."
"Overall,
Third Quarter Financial Results
Total revenue for the third quarter of 2021 was
Success in recognizing revenue from our SPL Programs was also a primary source of strength in the quarter. The Company recognized
Gross profit for the third quarter of 2021 was
Operating expenses for the third quarter of 2021 were
Partially offsetting this expense growth was a
Third quarter 2021 net loss was
Total cash, cash equivalents and short-term investments were $255.9 million as of
Preliminary 2021 Revenue
We are updating our revenue projection for fiscal year 2021. We now expect to achieve at least
Executive Leadership Addition
Webcast and Conference Call Details
MaxCyte will host a conference call today,
Form 10-Q
MaxCyte expects to file its Quarterly Report on Form 10-Q for the period ended
About MaxCyte
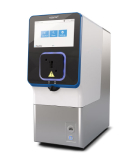
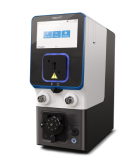
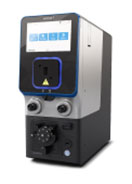
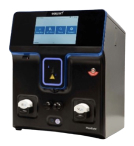
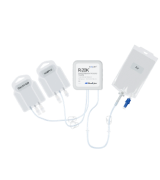
MaxCyte is a leading commercial cell-engineering company focused on providing enabling platform technologies to advance innovative cell-based research as well as next-generation cell therapeutic discovery, development and commercialization. Over the past 20 years, we have developed and commercialized our proprietary Flow Electroporation® platform, which facilitates complex engineering of a wide variety of cells. Our ExPERT™ platform, which is based on our Flow Electroporation technology, has been designed to support the rapidly expanding cell therapy market and can be utilized across the continuum of the high-growth cell therapy sector, from discovery and development through commercialization of next-generation, cell-based medicines. The ExPERT family of products includes: three instruments, the ATx™, STx™ and GTx™; a portfolio of proprietary related disposable processing assemblies; and software protocols, all supported by a robust worldwide intellectual property portfolio.
Forward-Looking Statements
This press release contains "forward-looking statements" within the meaning of the "safe harbor" provisions of the Private Securities Litigation Reform Act of 1995, including but not limited to, statements regarding our revenue guidance for the year ending
MaxCyte Contacts:
|
US IR Adviser David Deuchler, CFA |
+1 415-937-5400
|
|
|
Nominated Adviser and Joint Corporate Broker Panmure Gordon Emma Earl / Freddy Crossley Corporate Broking Rupert Dearden |
+44 (0)20 7886 2500 |
|
|
UK IR Adviser Mary-Jane Elliott Chris Welsh
|
+44 (0)203 709 5700
|
|
|
|
|
|
MaxCyte, Inc.
Condensed Consolidated Balance Sheets
|
|
|
|
|
|
|
|
|
|
|
|
|
|
||
|
|
|
2021 |
|
2020 |
||
|
|
|
|
(Unaudited) |
|
|
(Note 2) |
|
Assets |
|
|
|
|
|
|
|
Current assets: |
|
|
|
|
|
|
|
Cash and cash equivalents |
|
$ |
58,973,500 |
|
$ |
18,755,200 |
|
Short-term investments, at amortized cost |
|
|
196,914,700 |
|
|
16,007,500 |
|
Accounts receivable, net |
|
|
5,958,100 |
|
|
5,171,900 |
|
Inventory, net |
|
|
4,148,400 |
|
|
4,315,800 |
|
Other current assets |
|
|
3,541,900 |
|
|
1,003,000 |
|
Total current assets |
|
|
269,536,600 |
|
|
45,253,400 |
|
|
|
|
|
|
|
|
|
Property and equipment, net |
|
|
6,810,100 |
|
|
4,546,200 |
|
Right of use asset - operating leases |
|
|
1,025,100 |
|
|
1,728,300 |
|
Right of use asset - finance leases |
|
|
- |
|
|
218,300 |
|
Other assets |
|
|
318,100 |
|
|
33,900 |
|
Total assets |
|
$ |
277,689,900 |
|
$ |
51,780,100 |
|
|
|
|
|
|
|
|
|
Liabilities and stockholders' equity |
|
|
|
|
|
|
|
Current liabilities: |
|
|
|
|
|
|
|
Accounts payable |
|
$ |
723,300 |
|
$ |
890,200 |
|
Accrued expenses and other |
|
|
4,955,800 |
|
|
5,308,500 |
|
Operating lease liability, current |
|
|
572,300 |
|
|
572,600 |
|
Deferred revenue, current portion |
|
|
6,325,800 |
|
|
4,843,000 |
|
Total current liabilities |
|
|
12,577,200 |
|
|
11,614,300 |
|
|
|
|
|
|
|
|
|
Note payable, net of discount, and deferred fees |
|
|
- |
|
|
4,917,000 |
|
Operating lease liability, net of current portion |
|
|
500,200 |
|
|
1,234,600 |
|
Other liabilities |
|
|
496,600 |
|
|
788,800 |
|
Total liabilities |
|
|
13,574,000 |
|
|
18,554,700 |
|
|
|
|
|
|
|
|
|
Commitments and contingencies (Note 7) |
|
|
|
|
|
|
|
Stockholders' equity |
|
|
|
|
|
|
|
Common stock, |
|
|
1,004,300 |
|
|
773,800 |
|
Additional paid-in capital |
|
|
372,541,700 |
|
|
127,673,900 |
|
Accumulated deficit |
|
|
(109,430,100) |
|
|
(95,222,300) |
|
Total stockholders' equity |
|
|
264,115,900 |
|
|
33,225,400 |
|
Total liabilities and stockholders' equity |
|
$ |
277,689,900 |
|
$ |
51,780,100 |
MaxCyte, Inc.
Unaudited Condensed Consolidated Statements of Operations
|
|
|
|
|
|
|
|
|
|
|
|
|
|
|
|
|
|
Three Months Ended |
|
Nine Months Ended |
|
||||||||
|
|
|
2021 |
|
2020 |
|
2021 |
|
2020 |
|
||||
|
Revenue |
|
$ |
10,139,100 |
|
$ |
6,762,600 |
|
$ |
23,742,100 |
|
$ |
17,654,900 |
|
|
Cost of goods sold |
|
|
943,800 |
|
|
734,800 |
|
|
2,421,500 |
|
|
1,860,100 |
|
|
Gross profit |
|
|
9,195,300 |
|
|
6,027,800 |
|
|
21,320,600 |
|
|
15,794,800 |
|
|
|
|
|
|
|
|
|
|
|
|
|
|
|
|
|
Operating expenses: |
|
|
|
|
|
|
|
|
|
|
|
|
|
|
Research and development |
|
|
2,774,800 |
|
|
4,517,900 |
|
|
12,058,000 |
|
|
12,852,800 |
|
|
Sales and marketing |
|
|
3,211,500 |
|
|
2,039,000 |
|
|
8,913,500 |
|
|
5,933,000 |
|
|
General and administrative |
|
|
5,651,900 |
|
|
2,313,200 |
|
|
13,582,500 |
|
|
5,684,200 |
|
|
Total operating expenses |
|
|
11,638,200 |
|
|
8,870,100 |
|
|
34,554,000 |
|
|
24,470,000 |
|
|
Operating loss |
|
|
(2,442,900) |
|
|
(2,842,300) |
|
|
(13,233,400) |
|
|
(8,675,200) |
|
|
|
|
|
|
|
|
|
|
|
|
|
|
|
|
|
Other income (expense): |
|
|
|
|
|
|
|
|
|
|
|
|
|
|
Interest and other expense |
|
|
(289,000) |
|
|
(263,200) |
|
|
(1,044,400) |
|
|
(545,000) |
|
|
Interest income |
|
|
51,500 |
|
|
6,800 |
|
|
70,000 |
|
|
55,500 |
|
|
Total other income (expense) |
|
|
(237,500) |
|
|
(256,400) |
|
|
(974,400) |
|
|
(489,500) |
|
|
Provision for income taxes |
|
|
- |
|
|
- |
|
|
- |
|
|
- |
|
|
Net loss |
|
$ |
(2,680,400) |
|
$ |
(3,098,700) |
|
$ |
(14,207,800) |
|
$ |
(9,164,700) |
|
|
Basic and diluted net loss per share |
|
$ |
(0.03) |
|
$ |
(0.04) |
|
$ |
(0.16) |
|
$ |
(0.14) |
|
|
Weighted average shares outstanding, basic and diluted |
|
|
84,706,516 |
|
|
77,085,305 |
|
|
87,178,217 |
|
|
66,812,252 |
|
MaxCyte, Inc.
Unaudited Condensed Consolidated Statements of Cash Flows
|
|
|
|
|
|
|
|
|
|
|
Nine Months Ended |
||||
|
|
|
2021 |
|
2020 |
||
|
Cash flows from operating activities: |
|
|
|
|
|
|
|
Net loss |
|
$ |
(14,207,800) |
|
$ |
(9,164,700) |
|
|
|
|
|
|
|
|
|
Adjustments to reconcile net loss to net cash used in operating activities: |
|
|
|
|
|
|
|
Depreciation and amortization |
|
|
1,007,400 |
|
|
768,500 |
|
Net book value of consigned equipment sold |
|
|
39,200 |
|
|
35,700 |
|
Loss on disposal of fixed assets |
|
|
18,500 |
|
|
6,500 |
|
Fair value adjustment of liability classified warrant |
|
|
645,400 |
|
|
199,400 |
|
Stock-based compensation |
|
|
5,510,400 |
|
|
1,704,600 |
|
Bad debt recovery |
|
|
- |
|
|
(117,200) |
|
Amortization of discounts on short-term investments |
|
|
(39,500) |
|
|
(5,300) |
|
Noncash interest expense |
|
|
5,400 |
|
|
16,300 |
|
|
|
|
|
|
|
|
|
Changes in operating assets and liabilities: |
|
|
|
|
|
|
|
Accounts receivable |
|
|
(786,200) |
|
|
(379,200) |
|
Inventory |
|
|
(300,200) |
|
|
(782,200) |
|
Other current assets |
|
|
(2,538,900) |
|
|
(357,000) |
|
Right of use asset - operating leases |
|
|
858,000 |
|
|
390,200 |
|
Right of use asset - finance lease |
|
|
63,500 |
|
|
59,600 |
|
Other assets |
|
|
(284,200) |
|
|
(33,900) |
|
Accounts payable, accrued expenses and other |
|
|
(431,350) |
|
|
(548,900) |
|
Operating lease liability |
|
|
(734,700) |
|
|
(278,600) |
|
Deferred revenue |
|
|
1,482,800 |
|
|
1,461,300 |
|
Other liabilities |
|
|
(27,100) |
|
|
155,000 |
|
Net cash used in operating activities |
|
|
(9,719,350) |
|
|
(6,869,900) |
|
|
|
|
|
|
|
|
|
Cash flows from investing activities: |
|
|
|
|
|
|
|
Purchases of short-term investments |
|
|
(202,867,700) |
|
|
(16,988,400) |
|
Maturities of short-term investments |
|
|
22,000,000 |
|
|
2,500,000 |
|
Purchases of property and equipment |
|
|
(2,712,050) |
|
|
(1,713,300) |
|
Proceeds from sale of equipment |
|
|
4,600 |
|
|
- |
|
Net cash used in investing activities |
|
|
(183,575,150) |
|
|
(16,201,700) |
|
|
|
|
|
|
|
|
|
Cash flows from financing activities: |
|
|
|
|
|
|
|
Net proceeds from issuance of common stock |
|
|
236,077,300 |
|
|
28,567,200 |
|
Borrowings under notes payable |
|
|
- |
|
|
1,440,000 |
|
Principal payments on notes payable |
|
|
(4,922,400) |
|
|
(1,440,000) |
|
Proceeds from exercise of stock options |
|
|
2,424,000 |
|
|
285,900 |
|
Principal payments on finance leases |
|
|
(66,100) |
|
|
(39,500) |
|
Net cash provided by financing activities |
|
|
233,512,800 |
|
|
28,813,600 |
|
Net increase in cash and cash equivalents |
|
|
40,218,300 |
|
|
5,742,000 |
|
Cash and cash equivalents, beginning of period |
|
|
18,755,200 |
|
|
15,210,800 |
|
Cash and cash equivalents, end of period |
|
$ |
58,973,500 |
|
$ |
20,952,800 |
|
|
|
|
|
|
|
|
|
|
|||||||||
|
Unaudited Revenue by Market (in thousands) |
|||||||||
|
|
|
|
|
|
|
|
|
|
|
|
|
|
|
Three Months Ended September 30, |
|
Nine Months Ended September 30, |
||||
|
|
|
|
2021 |
|
2020 |
|
2021 |
|
2020 |
|
|
|
|
|
|
|
|
|
|
|
|
Cell Therapy |
|
|
$ 6,226 |
|
|
|
|
|
$ 10,697 |
|
Drug Discovery |
|
|
1,909 |
|
2,002 |
|
5,510 |
|
4,952 |
|
Program-related |
|
|
2,004 |
|
252 |
|
2,512 |
|
2,005 |
|
Total Revenue |
|
|
$ 10,139 |
|
|
|
|
|
$ 17,655 |
RNS may use your IP address to confirm compliance with the terms and conditions, to analyse how you engage with the information contained in this communication, and to share such analysis on an anonymised basis with others as part of our commercial services. For further information about how RNS and the
